International land deals: who is investing and where - get the data

Medium_get-the-detail

The Guardian | 27.4.2012

International land deals: who is investing and where - get the data

Explore the global database on more than 1,000 land deals covering an area roughly half the size of western Europe

World's largest public database of land deals launched

Over the past few years, so-called "land grabs" have become an increasingly hot topic. But reliable data has been hard to find. Now, an international coalition of NGOs and research groups has published the world's largest database of deals struck since 2000, offering unprecedented detail on who's investing, where and what for.

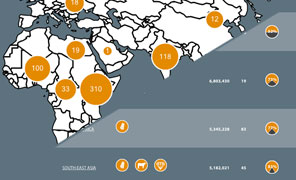
The database, launched on Thursday, includes 1,006 deals covering 70.2m hectares (173m acres) – or roughly half the size of western Europe. Data on further deals will be added on an ongoing basis.

Some highlights from the database:

• Eastern Africa has the largest number of recent investments, with 310 deals.

• Indonesia is the country with the largest area of land acquired by investors – 9.5m hectares. The Democratic Republic of the Congo comes second, with almost 8.1m hectares.

• The Indian government, Chinese telecommunications firm ZTE International and Indonesian company Indah Kiat Pulp & Paper are the top three investors, having acquired more than 10m hectares around the world between them.

• The vast majority of the deals are for agricultural projects (690 deals covering 50.2m hectares). Forestry is the next largest sector (94 deals covering 12.7m hectares).

• Of the agricultural deals, fewer than 30% are for food crops alone. Almost 20% are for non-food crops such as biofuels and livestock feed.

The Land Matrix database is now the most comprehensive public source for information on international land deals – but it is not perfect. Some countries, for example, may be over-represented in the data simply because they are more transparent and routinely publish contract information. In other cases, the data may be skewed towards investors or countries that have featured in more media reports.

This makes it difficult to draw too many conclusions from the data. For example, there appears to be a sharp decline in deals since 2009 – but although this could correspond to a drop in investments, it could also be driven by a fall in media interest or an increasing reluctance to disclose information about deals.

Researchers warn that smaller deals are often harder to track and may be under-represented in the database. Data for deals struck after 2010 is still being collected, cross-checked and verified.

Researchers hope that releasing the data and inviting the public to crowdsource new information will help address some of these issues. The site lets users "report a land deal" or submit further details on deals already recorded. This information will be independently verified by researchers before being included in the database.

We have pulled out all the data on who's investing, where and what for. You can browse key figures below, or download the full dataset. What can you do with the data?

Data summary

Top 10 investors

Click heading to sort table. Download this data

 
Investor
Investor's Country
Hectares
Deals
Location of Investments
Indian Government India 4877419 9 India, Ethiopia
ZTE International China 2800000 1 DRC
Indah Kiat Pulp & Paper Indonesia 2388468 1 Indonesia
Wuhan Kaidi Unknown 2000000 1 Zambia
Tata Power India 2000000 1 Indonesia
Samling Group Malaysia 1838000 1 Malaysia
Al Ain National Wildlife United Arab Emirates 1680000 1 Sudan
Daewoo Logistics Republic of Korea 1600000 2 Madagascar
Sinar Mas Group Indonesia 1600000 2 Indonesia
Muting Hijau Indonesia 1100000 1 Indonesia


Where land has been acquired (since 2000)

Click heading to sort table. Download this data

 
Country
Region
Hectares
Deals
Indonesia South-East Asia 9527760 24
Democratic Republic of the Congo Central Africa 8051870 10
Ethiopia Eastern Africa 5345228 83
Philippines South-East Asia 5182021 45
Malaysia South-East Asia 4819483 20
India South Asia 4628578 113
Sudan Northern Africa 3923430 18
Brazil South America 3871824 61
Madagascar Eastern Africa 3779741 39
Zambia Eastern Africa 2273413 9
United Republic of Tanzania Eastern Africa 2194975 58
Mozambique Eastern Africa 1983127 92
Argentina South America 1505020 22
Cambodia South-East Asia 1154194 86
Russian Federation Eastern Europe 1113434 11
China Eastern Asia 1108396 12
Benin Western Africa 1040900 9
Cameroon Central Africa 710340 17
Liberia Western Africa 679000 6
Ghana Western Africa 669900 9
Ukraine Eastern Europe 662167 7
Kenya Eastern Africa 633500 13
Sierra Leone Western Africa 588950 11
Mali Western Africa 581891 27
Peru South America 571900 26
Lao People's Democratic Republic South-East Asia 478153 49
Colombia South America 420820 14
Australia Australia and New Zealand 400926 3
Nigeria Western Africa 362532 21
Malawi Eastern Africa 310147 7
Senegal Western Africa 234800 8
Côte d'Ivoire Western Africa 207200 5
Zimbabwe Eastern Africa 201171 2
Angola Central Africa 183000 4
Viet Nam South-East Asia 156540 7
Congo Central Africa 138000 2
Guatemala Central America 81006 10
Papua New Guinea Melanesia 79178 1
Uganda Eastern Africa 76512 4
Mexico Central America 56581 5
Bolivia (Plurinational State of) South America 37156 4
Niger Western Africa 29969 3
Bangladesh South Asia 29456 2
Thailand South-East Asia 28912 3
South Africa Southern Africa 27124 3
Somalia Eastern Africa 21500 2
Swaziland Southern Africa 15124 2
Ecuador South America 8000 1
Costa Rica Central America 7658 5
Solomon Islands Melanesia 7577 1
Pakistan South Asia 5926 3
Turkey Middle East 4500 1
Rwanda Eastern Africa 3100 1
Chile South America 1400 2
Suriname South America 1073 2
Burkina Faso Western Africa 1000 1

DATA: download the full spreadsheet

  • Sign the petition to stop Industria Chiquibul's violence against communities in Guatemala!
  • Who's involved?

    Whos Involved?


  • 13 May 2024 - Washington DC
    World Bank Land Conference 2024
  • Languages


    Special content


    Archives


    Latest posts